
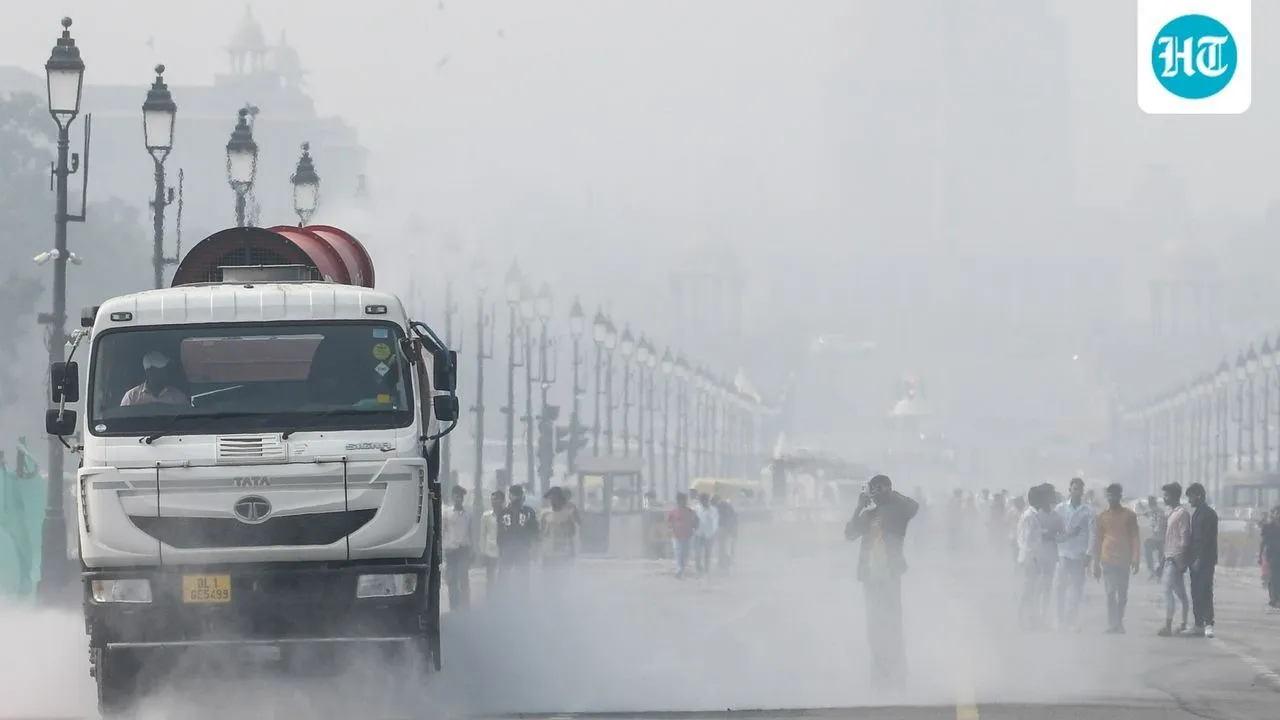
On Diwali night, as monitors in Delhi recorded fine-particle pollution of up to 62 times the national daily limit, the city’s official air quality index (AQI) went down. It read 373 at 11pm on November 8 and 366 at 6am the next morning.
The Central Pollution Control Board (CPCB) said this is how the system is meant to work. In a statement on November 10, it said its analysers of particulate matter – ultra-fine pollutants – were calibrated for readings up to 1,000 micrograms per cubic metre (µg/m³), anything higher is out of range, and “those hours do not contribute to the 24-hour average”.
The AQI's ceiling of 500, it added, is “a design feature of the index”. The difference in CPCB’s AQI and other assessments – some of which were in four-digits – was due to differences in measurement and methodology, not because of “under-reporting”.
HT tested this defence against CPCB’s records, using its own method, and it didn’t work on three counts. One, the index is built in a way that an extreme reading cannot distort it. So, the hours not counted in the overall AQI could not have skewed it. Two, discarding those hours could only move the AQI in one direction. CPCB published 370 for the 24 hours to 9am on November 9; and with every hour re-counted, the figure was 393. Three, the practice removed ten of the city's worst-hit stations from its average altogether.
1) AQI calculation, and redundant cuts
Every hour, each station’s reading of PM2.5 and PM10 – measured as concentration, in µg/m³ –
gets converted into a score. This score increases as the concentration goes up, and maxes out at 500.
A station’s AQI is the average of its last 24 hour-scores, and scores of at least 16 hours are needed to get this figure, rules say. All of Delhi’s AQI is the average of AQI at its stations. Worked this way, HT's calculation matched CPCB’s AQI published for Delhi to within half- a-point for 18 consecutive hours.
In its statement, CPCB made two arguments – that the AQI can be a maximum of 500 by design, and that any pollutant readings that exceed 1,000 µg/m³ must be discarded.
But these arguments work against each other. An hour gets the maximum score of 500 once PM2.5 reaches about 420 µg/m³, less than half of 1,000 µg/m³. A reading of 450 µg/m³ scores AQI at 500, and so does a reading of 999. A reading of 1,001 µg/m³ would score 500 too, as would the 3,744 µg/m³ that a Delhi Pollution Control Committee (DPCC) monitor recorded at Mundka at 2am.
Counting the hours when PM2.5 or 10 readings exceeded 1,000 µg/m³ could not have pushed the AQI any higher than the index already allowed.
In CPCB’s records for November 7 to November 9, all 275 hourly PM2.5 readings of 450 µg/m³ or more scored exactly 500 AQI for that hour.
HT Immersive | The smog Delhi can’t wish away
Delhi's air · Diwali 2026
How the hours CPCB left out pulled each station's AQI down
A station's AQI is the average of its last 24 hourly scores. The box marks those 24 hours. Pick a station and move through Diwali night to see the hours above 1,000 µg/m³ drop out of the average.
Station Hour
hour CPCB counted hour CPCB left out, drawn at the 500 it would have scored
24 hours to
PM2.5 hours CPCB kept
CPCB's AQI (solid line)
Night hours counted (dashed)
Bars are CPCB's hourly PM2.5 scores. A station's AQI is the higher of its PM2.5 and PM10 averages and needs at least 16 hours. Hatched bars are hours CPCB left out between 9pm on November 8 and 7am on November 9, drawn at 500. Empty slots after 7am had no reading and are not counted.
Source: CPCB's hourly sub-indices and AQIs from its live feed (read 5.18pm, November 9) as read by HT; DPCC's own site, dpccairdata.com (readings released November 9). HT's calculation by CPCB's own method. Figures are provisional. Analysis: HT Pollution Dashboard
Any reading past 420 µg/m³ is enough to score an hour at 500, and a reading that has run off the instrument’s scale is certainly past 420.
Between 9pm and 7am on Diwali night, CPCB’s system gave the top score (or AQI 500) to 167 hourly readings that logged pollutant concentrations under 1,000 µg/m³. There was no AQI score at all to 226 others.
DPCC has since published readings for 112 of those 226 hours, and each is above 1,000 µg/m³. Of the 50 gaps that opened that night, 45 began in the hour after a station had scored 500.
A single hour could not have skewed the average either. It is twenty-fourth of a station’s AQI, so even at the full 500, it can shift the figure by 21 points at most.
CPCB said the air quality index is meant to capture “prolonged exposure, rather than a momentary reading”. But the 24-hour average already does that, with every hour counted.
2) What deducting those hours did
Leaving an hour out of an average is identical to assuming that it resembled the rest. On Diwali night, the hours that were discarded from the city’s AQI calculation were nothing like the rest.
At Nehru Nagar, the official AQI was 387 at 10pm. For the next eight hours, DPCC’s monitor there read pollutant concentrations between 1,658 µg/m³ and 2,808 µg/m³. CPCB dropped all eight for the AQI calculation and averaged the remaining 16 hours, of which 14 came before 8pm, when the evening window for bursting firecrackers opened. (The Supreme Court had allowed bursting of relatively lower emission firecrackers from 8pm to 10pm on Diwali night.)
With its most polluted hours left out, the station’s AQI dropped every hour through the night, to 344 at 6am. At 7am, there was no data for the ninth straight hour. So, the station now had scores for only 15 of its last 24 hours, one short of the 16 that CPCB requires and it did not get counted in the city AQI at all.
In the last two hours that CPCB did count, from 8pm to 10pm, PM2.5 was 659 µg/m³ and 812 µg/m³, and each hour got the maximum score of 500. The eight hours that followed were more polluted still. If they are given scores at 500 as well, Nehru Nagar’s AQI at 6am would come to 396.
CPCB published 344. That 344 would be accurate only if PM2.5 concentrations in those eight hours had averaged about 177 µg/m³. DPCC’s monitor, however, recorded concentrations between 1,658 and 2,808 µg/m³.
Also read: Farm fires, the missing numbers, and why real numbers are an undercount
Between 9pm and 6am, the published AQI rose by an average of nearly 11 points at the 16 stations where none of the hours were discarded. At the eight stations that lost seven or more hours, it fell by more than 26 points.
As published, the AQI fell overnight at 35 of Delhi’s 59 stations. If the discarded hours are scored at 500, it rises at 47 stations.
HT recalculated the city’s AQI, changing one input.
Every hour that CPCB left blank between 9pm and 7am was entered at 999 µg/m³, the top of the range that the board said its analysers were calibrated for. The 9am figure for AQI rises from 370 to 393. The 4pm bulletin, the number that enters the official record, would then rise from 344 to 372.
Other ways of counting the hours gave similar figures. Using only the readings DPCC published, and ignoring every gap at stations run by CPCB and the Indian Institute of Tropical Meteorology (IITM), gives 384 and 357.
3) The stations that vanished
The third count is the stations that dropped out. Under a separate rule, a station with fewer than 16 hours gets no AQI and is left out of Delhi’s average.
CPCB’s statement mentioned “a data gap at the particular station concerned” but not this consequence.
By 9am, ten of the 59 stations had gone, among them Nehru Nagar, RK Puram, Dwarka Sector 8 and NSUT Jaffarpur. By 4pm, 12 had. With their missing hours counted, nine of the 10 would have been “severe”, with AQIs of 403 to 435. The published 370 AQI was the average of the 49 that remained.
The CPCB also called firecracker pollution “episodic and short lived”. The gaps in its records lasted for hours. Of the 43 stations with PM2.5 hours missing that night, 32 had uninterrupted gaps of four hours or more, and seven had gaps of eight or more. At the 20 DPCC stations where the gaps can be filled, the discarded hours held 70% of the day’s PM2.5 at the median station. At NSUT Jaffarpur, the 14 hours CPCB counted averaged at 268 µg/m³ and the ten hours it discarded averaged 2,347 µg/m³.
At these stations, CPCB’s 24-hour figure covered the cleaner part of the day.
At 6am, when every station still had an AQI, the previous 24 hours of PM2.5 concentrations are known, or very nearly, for 30 of them. Nehru Nagar recorded the highest levels of PM2.5 concentrations of the 30 stations, but CPCB’s index placed it 24th among them, ranking 23 other stations as more polluted than it.
The category, and the record
CPCB said the AQI’s category – between good, satisfactory, poor, very poor and severe – matters more than the number it is given.
For Delhi's average, the category is unchanged, since 370 and 393 are both “very poor”. For individual stations, though, it changes.
At 9am, CPCB’s figures put 14 of the stations in “severe”, the band in which, by its own description, even healthy people may be affected. A recalibration puts 27 there. The same at 4pm puts one station in “severe” against 15.
The published figures also change how this Diwali goes into the record. In CPCB’s 4pm bulletins from 2015 to 2025, Delhi’s air quality was worse the day after Diwali than on Diwali in the ten out of 11 years. This year’s bulletins show a fall of 32 points, from 376 to 344, the largest in the series. With every hour counted, the fall is four points.
What EPA and the instrument manual say
CPCB twice cited the US’s Environmental Protection Agency (EPA) in its support for AQI calculation.
EPA scores readings beyond the top of its scale and reports them. Its guidance, in the 2018 edition, said an AQI value "can still be computed to indicate relative magnitude", and told agencies how.
An analyser at the top of its range need not return a blank either. According to the manual for the Met One BAM-1020, a widely used particulate analyser, its range can be set at values from 100 to 10,000 µg/m³, and a concentration above the chosen range is reported at the upper limit.
HT has not established which models Delhi's stations use, but DPCC’s website published readings as high as 3,744 µg/m³ for the hours in question.
The practice appears to be old. Last Diwali, CPCB’s public feed carried readings above 1,000 µg/m³ at 29 of the 39 stations Delhi then had. Scored by HT’s method, that feed gives 373 for the day after Diwali with every hour counted and 351 with the hours above 1,000 µg/m³-readings left out. CPCB published 351. The check is indicative, since it uses PM2.5 alone, but the match is close.
The board said the practice is under review. “Internal deliberations and consultations with respect to processing of data beyond system design range are underway,” its statement said.
The analysis does not show intent. CPCB said its system is automated, has run since the index began, and the 2025 check is consistent with that. Readings for the gaps at stations run by CPCB and IITM remain unpublished, so the recount assumes, as the board's statement indicated, that they were out of range. For the result to hold, they need only have been above 420. Delhi’s 24-hour AQI is “very poor” either way.
On all three counts, the evidence is CPCB's own. Its published figures were lower than its own measurements and its own formula yield when every hour is counted. That is under-reporting, whatever its cause.
Data and method:
CPCB's hourly PM2.5 and PM10 scores (sub-indices), station AQIs and Delhi AQIs are from its live feed, as read by HT's server at 5.18pm on November 9. Measured readings are from CPCB's Central Control Room records. DPCC's readings are those shown on its own website, pulled at 8.08pm on November 9; CPCB has not published them. All figures are provisional.
HT's calculation follows the published figures: a station's AQI is the average of its last 24 hourly scores for PM2.5 or PM10, whichever is higher, with at least 16 hours; Delhi's AQI is the average of the station AQIs. In the recount, PM2.5 and PM10 hours with no score between 9pm on November 8 and 7am on November 9 are scored at 500, and each station's published AQI is adjusted by the change that makes, so that nothing else in CPCB's figure is altered. A station counts as "severe" at 401 or above.
Hours are named by their start in station readings, and AQIs by the hour at which the 24 hours end. The 2018 edition of EPA's guidance was used.