
The Ras family of small GTPases comprises some of the most frequently mutated oncogenes in human cancers, with activating mutations present in ~25% of all tumor cells1. In humans, four Ras proteins are encoded: H-Ras, N-Ras, and two splice variants of K-Ras (K-Ras4A and K-Ras4B), which together represent the classical Ras subfamily within the larger Ras superfamily of more than 150 related small GTPases2. As molecular switches, Ras proteins alternate between a GTP-bound active form and a GDP-bound inactive form to regulate essential cellular processes such as growth, differentiation, and survival3,4.
Activated Ras transmits signals from receptor tyrosine kinases to major downstream pathways, most prominently the RAF–MEK–ERK and PI3K–AKT cascades, thereby controlling proliferation and survival3. Mutations in KRAS are highly prevalent in pancreatic, colorectal, and lung cancers, whereas NRAS and HRAS mutations are frequently detected in melanoma and other malignancies5.
Ras possesses intrinsic activities for both GDP-to-GTP exchange (activation) and GTP hydrolysis (inactivation), which are tightly regulated by guanine nucleotide exchange factors (GEFs) and GTPase-activating proteins (GAPs), respectively3,4. Importantly, the most common oncogenic Ras mutations, such as G12D, G12V, and G13D, exhibit markedly reduced intrinsic GTPase activity and are resistant to GAP stimulation, leading to constitutive activation and uncontrolled cell proliferation6,7,8. Because these mutants effectively lock Ras in its active form, elucidating the intrinsic GTP hydrolysis mechanism across both short and extended timescales independent of GAPs could emerge as a promising approach to develop therapeutic strategies that restore or mimic Ras self-inactivation9,10,11,12.
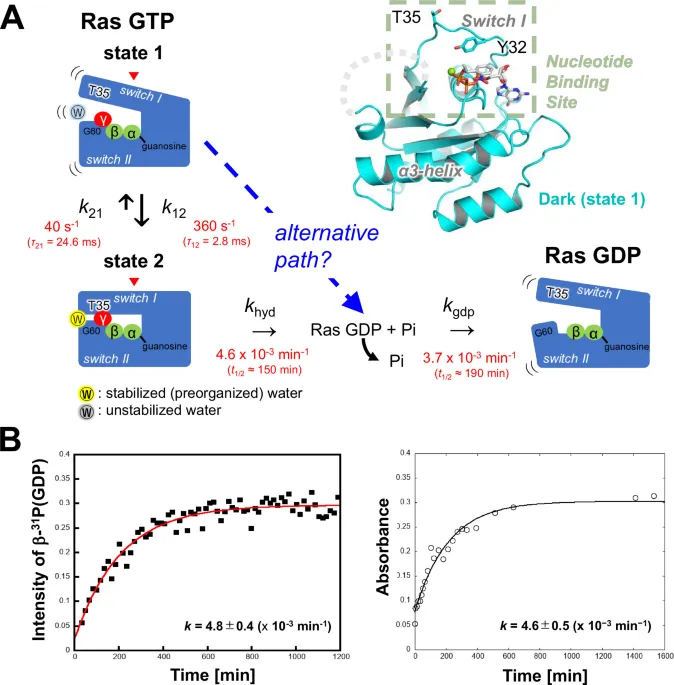
Over the last several decades, extensive structural studies have revealed key conformational features of Ras that are essential for the precise regulation of its signaling activity as a small GTPase8. In particular, the combination of nuclear magnetic resonance (NMR) spectroscopy and X-ray crystallography revealed that GTP-bound Ras exists in a dynamic equilibrium between at least two major conformational states, known as state 1 and state 2, which correspond to inactive and active forms, respectively (Fig. 1A)13,14,15,16,17,18,19,20. In solution, this interconversion occurs rapidly, with rate constants of k₁₂ = 360 s⁻¹ (τ12 = 2.8 ms) for the transition from state 1 to state 2 and k₂₁ = 40 s⁻¹ (τ21 = 24.6 ms) for the reverse transition20. These values indicate that state 2 predominates, accounting for ~90% of the Ras population under physiological conditions (Fig. 1A)20.
Structurally, state 2 is characterized by a closed switch I loop (residues 30–40), a region critical for effector recognition. This conformation is stabilized through an interaction between Thr35 and the γ-phosphate of GTP, which facilitates binding to the Ras-binding domain (RBD) of downstream effectors (Fig. 1A, state 2 model)18,21,22. In addition, the side chain of Thr35 coordinates the Mg²⁺ ion, forming part of the nucleotide-binding coordination network that stabilizes the closed switch I conformation. Importantly, a nucleophilic water molecule is observed near the γ-phosphate in state 2 structures and has been proposed to facilitate nucleophilic attack during both intrinsic and GAP-mediated GTP hydrolysis (Fig. 1A, state 2 model).
In contrast, state 1 does not represent a single well-defined structure but rather an ensemble of more open conformations that lack the structural coordination features characteristic of state 223. These conformations are generally characterized by disengagement of Thr35 from Mg²⁺ and/or the γ-phosphate, outward displacement or increased flexibility of switch I, and reduced stabilization of switch II elements involved in organizing the catalytic water (Fig. 1A, state 1 model). Consistent with this structural distinction, several recent computational analyses of Ras conformational transitions have likewise used disruption of the Mg²⁺–OThr35 coordination as a key structural coordinate distinguishing the closed state 2 configuration from more open conformations24. Consequently, state 1 has generally been considered less favorable for effector interactions and catalytic organization relative to state 2 (Fig. 1A)22. Intriguingly, oncogenic mutants such as G12V and G13D preferentially adopt the state 1 conformation25,26.
Despite the rapid exchange between these conformational states, the intrinsic GTPase activity of Ras is remarkably slow, with a rate constant of 4 × 10⁻⁵ s⁻¹ (2.4 × 10⁻³ min⁻¹)20. This rate is 6–7 orders of magnitude slower than the conformational transition, indicating that GTP hydrolysis occurs infrequently and likely from a specific structural state—long presumed to be state 2.
Indeed, numerous experimental and computational studies have supported the notion that GTP hydrolysis proceeds via state 2, in which the catalytic machinery, including the nucleophilic water molecule, is properly organized27,28,29,30,31.
Ras has also served as a model system for time-resolved and kinetic crystallographic investigations aimed at directly visualizing nucleotide hydrolysis reactions. Early pioneering studies by Schlichting and colleagues employed photocaged GTP and time-resolved Laue diffraction to capture structural changes during hydrolysis in H-Ras crystals32. Subsequent kinetic crystallography approaches, including cryo-trapping experiments and analyses in space groups such as P3221 and P41, further characterized structural transitions accompanying GTP cleavage (Fig. 1A, GDP-bound model)31,33,34,35. These studies provided important insights into rearrangements of the switch I and switch II regions and identified conformations consistent with a preorganized catalytic water molecule in a state 2-like configuration prior to hydrolysis. Complementary spectroscopic approaches, including electron paramagnetic resonance (EPR)/NMR and Fourier transform infrared (FTIR) measurements of photocaged GTP hydrolysis, examined charge redistribution within the γ-phosphate during catalysis and supported mechanistic models derived from structural and computational analyses15,19,36,37,38,39,40,41. Notably, however, most of these structural and spectroscopic investigations were conducted under conditions in which Ras adopted a state 2 configuration before reaction initiation.
However, Ras is known to exhibit significant conformational plasticity, and NMR studies have suggested that multiple conformational states—potentially including state 1—may be accessible during catalysis42. Several structural models now propose that GTP hydrolysis must pass through a state 2 configuration (Fig. 1A) characterized by an optimized water network and favorable geometry for in-line attack on the γ-phosphate20,30,31,33,34,35. However, recent computational studies have questioned whether such water stabilization for activation near the γ-phosphate is an absolute requirement for the initiation of hydrolysis43,44. Notably, these simulations typically use state 2 as the initial structure, leaving open the possibility that state 1—previously considered hydrolytically less competent and lacking the catalytic arrangement typically observed in state 2 structures—may, under certain conditions, contribute directly to GTP hydrolysis. This highlights the need for experimental systems capable of directly capturing GTP hydrolysis from state 1 over extended timescales to evaluate its catalytic potential. A major challenge, however, is that common oncogenic mutants such as G12V and G13D hydrolyze GTP extremely slowly—often taking several days—making them impractical for time-resolved structural studies aimed at capturing transient intermediates within experimentally tractable timeframes. WT Ras, which undergoes intrinsic hydrolysis on a tractable timescale, therefore provides a suitable model system for investigating the structural basis of Ras self-inactivation.
In this work, we use WT Ras as a model system to visualize the sequential progression of intrinsic GTP hydrolysis over timescales ranging from milliseconds to hours. We combine a photoactivatable GTP analogue, NPE-caged GTP, with solid-state and solution NMR, time-resolved serial femtosecond crystallography (TR-SFX), and serial synchrotron crystallography (SSX). These analyses reveal a trajectory in which Ras remains in a state 1-like conformation and proceeds to the GDP-bound state without adopting the closed state 2 configuration traditionally associated with catalytic organization of the nucleophilic water molecule. Our findings therefore suggest that state 1 can support intrinsic GTP hydrolysis under certain conditions and provide a structural framework for considering Ras self-inactivation in oncogenic mutants that preferentially adopt this conformation.
Crystalline Ras retains native GTPase kinetics
To investigate the roles of the conformational states of Ras during GTP hydrolysis, we first assessed whether the crystalline environment altered the reaction kinetics. We evaluated the long-term stability of three photoactivatable GTP analogues—2-nitrophenylethyl R (NPE(R))-caged GTP, 2-nitrophenylethyl S (NPE(S))-caged GTP, and p-hydroxyphenacyl (pHP)-caged GTP—bound to H-Ras in solution. On the basis of these analyses, NPE(R)-caged GTP (hereafter referred to as NPE-caged GTP) was selected as the most suitable candidate for long-term structural studies (see Supplementary Discussion, section 1: Selection and characterization of caged-GTP compounds).
We next examined the kinetics of GTP hydrolysis in Ras/NPE-caged GTP microcrystals using solid-state 31P cross-polarization magic angle spinning (CP-MAS) NMR. The measurements were performed directly on intact microcrystalline slurries loaded into microcapsules and placed within the MAS rotor, allowing kinetic monitoring without dissolution while preserving the crystalline environment.
The spectra were collected at 17-min intervals following photoirradiation. Prior to irradiation, a γ-phosphate signal from caged GTP was observed at–11.54 ppm (Supplementary Fig. 1A). Following photoirradiation, this signal disappeared, and a new γ-phosphate peak corresponding to natural GTP emerged at –7.19 ppm (Supplementary Fig. 1B, spectrum recorded after photoirradiation), indicating successful removal of the NPE moiety and the formation of Ras/GTP.
The α-phosphate of natural GTP was detected at –12.01 ppm, with slight peak broadening (linewidth of ~250 Hz), possibly reflecting conformational heterogeneity in the GTP-bound state. Importantly, the β-phosphate signal of GDP at –2.85 ppm appeared well resolved, and its intensity increased progressively over time (Supplementary Fig. 1B, C), making it a reliable marker for tracking GTP hydrolysis.
On the basis of the time-dependent changes in the β-phosphate signal of GDP, the hydrolysis rate constant in the crystal was determined to be k = 4.8 ± 0.4 × 10⁻³ min⁻¹ (Fig. 1B, solid-state NMR analysis). This value is in close agreement with the rate measured in our solution-based biochemical assays (k = 4.6 ± 0.5 × 10⁻³ min⁻¹; Fig. 1B, solution-based biochemical assay) and is consistent with a previously reported value for intrinsic GTPase activity6.
These results indicate that the crystalline environment largely preserves the intrinsic GTP hydrolysis kinetics of Ras, potentially recapitulating the reaction observed in solution. This supports the feasibility of using our Ras microcrystals for time-resolved crystallographic studies and suggests that the structural snapshots captured in the crystal likely reflect catalytically relevant conformations of Ras.
Photoactivated Ras transitions from state 1 to GDP-bound form without exiting the lattice
To gain structural insight into the conformational transitions that accompany GTP hydrolysis, we performed time-resolved crystallographic analysis of Ras using SSX following photoactivation45. As reference points for the reaction trajectory, we first determined the crystal structures of Ras/NPE-caged GTP in the dark (prior to uncaging) and of Ras/GDP that formed after completion of the hydrolysis reaction. Both structures were resolved in the same crystal form, space group R32 (see Supplementary Table 1), enabling direct structural comparison across the reaction timeline.
In the pre-irradiation Ras/NPE-caged GTP structure (PDB ID 9WRP), the switch I loop (residues 30–38) exhibited pronounced outward displacement, resulting in disruption of the coordination network characteristic of the state 2 conformation between the side chain of Thr35 and the Mg²⁺ ion. The side chain of Thr35 was rotated away from the nucleotide-binding site (Fig. 1A, dark-state Ras/NPE-caged GTP structure; RAS GTP, state 1 model), which is in stark contrast to the typical GTP-bound state 2 conformation observed in Ras/GppNHp complexes (Supplementary Fig. 2A).
Superimposition with previously reported Ras/NPE-caged GTP structures in different crystal forms that adopt state 2 (e.g., PDB IDs: 1GNR and 2EVW)31,34, which are characterized by a Thr35–γ-phosphate interaction, confirmed that the present structure is distinct from state 2 (Supplementary Fig. 2B). Instead, the current structure shares features with the less ordered state 1 conformation (e.g., PDB IDs: 3KKM, 5B30, 7DPH, and 7DPJ)21,22,46, although the geometry of the switch I loop differs from those of previously reported state 1 structures (Supplementary Fig. 2C).
We speculate that steric hindrance between the bulky NPE group and the side chain of Tyr32, in addition to crowding between Tyr32 and Pro34 (Supplementary Fig. 2C, red arrows), forced the displacement of the switch I loop to an outward configuration. This spatial constraint likely precluded the formation of a closed state 2 conformation and instead stabilized a previously uncharacterized open conformation within the broader state 1 landscape (Fig. 1A, Ras/NPE-caged GTP structure; Fig. 2A, dark-state Ras/NPE-caged GTP structure).
We subsequently determined the structure of Ras at 28 h postirradiation (PDB ID 9WRR), when GTP hydrolysis was complete according to 31P NMR kinetics (Fig. 1B, solid-state NMR analysis). This structure, which was resolved in the same R32 space group as the post-hydrolysis form, revealed a GDP-bound conformation (Fig. 2A, 28-h GDP-bound structure). The switch I region had reverted to the characteristic conformation observed in Ras/GDP complexes (e.g., PDB ID: 4Q21)47, whereas no electron density for the N-terminal portion of switch II (residues 59–69) was observed, suggesting structural disorder or flexibility.
These data reveal that Ras/NPE-caged GTP initially adopts a distinct open state 1 conformation, and that, following uncaging and subsequent GTP hydrolysis, Ras transitions directly to a canonical GDP-bound form within the same crystal lattice. This observation provides a structural framework for dissecting the conformational trajectory of Ras self-inactivation across the observed reaction timescale.
Ras catalyzes GTP hydrolysis from state 1 without a stabilized nucleophilic water
Having identified this distinct state 1 conformation of Ras/NPE-caged GTP in the crystal, we next sought to capture the structural transitions during GTP hydrolysis at atomic resolution. In particular, we aimed to determine whether the Ras/GTP complex undergoes a conformational change from open state 1 to closed state 2, which typically precedes catalysis in solution. To this end, we employed a time-resolved approach combining cryotrap technique, room temperature SSX and TR-SFX, covering timescales from milliseconds to hours after uncaging.
We first performed photoinduced SSX to analyse the structural changes that occur from minutes to hours after uncaging. The crystal structure obtained 15 min postirradiation (the 15-min structure, PDB ID 9WRQ) showed minor changes in lattice constants compared with the pre-irradiation structure (Supplementary Table 1) and revealed that the caged group was completely removed, resulting in the natural GTP-bound form of Ras (Fig. 2B, 15-min GTP-bound structure). Tyr32, which was previously displaced by the NPE group, occupied the vacated space and formed a hydrogen bond (2.6 Å) with the γ-phosphate of GTP (Fig. 2C, comparison of the dark-state and 15-min structures). Additionally, Gly60 in switch II, which was disordered before uncaging, became ordered and formed a hydrogen bond (3.0 Å) with the γ-phosphate (Fig. 2C, comparison of the dark-state and 15-min structures). Although Tyr32 and the backbone amide of Gly60 engage the γ-phosphate, our state assignment is not based on Thr35 displacement alone; rather, the collective absence of the structural coordination network characteristic of state 2—Thr35–Mg²⁺ coordination, a catalytically poised Gln61, and a stabilized nucleophilic water—distinguishes this conformation from state 2 (Fig. 2B, comparison with state 2 reference structures).
Superimposition of the pre-uncaging and 15-min structures revealed a substantial rearrangement of the switch I loop, particularly around Tyr32. In the 15-min structure, the switch I loop shifted towards the nucleotide-binding site (Fig. 2C), yet the side chain of Thr35 remained solvent-exposed, and no coordinated nucleophilic water molecule was observed (Fig. 2C, comparison of the dark-state and 15-min structures; Fig. 2B, comparison with state 2 reference structures). The side chain of Thr35 was located ~9.4 Å from the Mg²⁺ ion—too distant to allow coordination—indicating that Ras remained in an open state 1 conformation (Fig. 2C, comparison with the state 1 reference structure 5B30). These features closely resembled those of a previously reported state 1 structure (PDB ID: 5B30) (Fig. 2C, comparison with the state 1 reference structure 5B30)22, confirming that Ras/GTP remained in state 1 following uncaging.
To investigate whether Ras could transition between the conformational states, specifically to state 2 immediately after uncaging, we performed TR-SFX using microcrystals of Ras/NPE-caged GTP. On the basis of previously reported transition rates between state 1 and state 2 (k21 = 40 s⁻¹ and k12 = 360 s⁻¹ for K-Ras at 25 °C20) and the lifetime of states 1 and 2 (τ21 and τ12 = 24.6 and 2.8 ms in K-Ras) in solution (Fig. 1A), we selected 15 ms post-uncaging as the time point at which this transition will likely be captured. Crystallographic data collected at 15 ms and in the dark were compared using FO (15 ms)–FO (complete dark) difference maps at ~2.0 Å resolution (Supplementary Table 1). The difference Fourier maps were calculated exclusively from SFX datasets collected at identical temperature (293 K) and unit-cell parameters. These maps revealed clear negative electron density at the former NPE site (indicated by an asterisk in the SFX difference-map analysis in Fig. 2C), which is consistent with uncaging, and positive/negative paired peaks around Pro34 (indicated by a double asterisk in the SFX difference-map analysis in Fig. 2C), suggesting the movement of this residue towards the γ-phosphate. A distinct positive peak at the Tyr32 position (indicated by triple asterisk in the SFX difference-map analysis in Fig. 2C) matched its orientation in the 15-min SSX structure, indicating that the Ras/GTP conformation observed at 15 min had already formed within 15 ms post-uncaging. Importantly, no features corresponding to a state 2 conformation were detected at this time point.
To further trace the progression of GTP hydrolysis, we collected SSX datasets at multiple time points (2.5, 5, 10, and 20 h postirradiation; Supplementary Table 1) on the basis of the solid-state NMR data, with the possibility of capturing the transition from the GTP- to GDP-bound form at approximately the 5-h mark after uncaging. While the overall conformation remained similar to that of the 15-min structure for up to 5 h, gradual loss of electron density in the switch I region began after 10 h (Fig. 3A, 10-h and 20-h difference maps). From the isomorphous difference map (Fig. 3A and Supplementary Movie 1) for each time point calculated using 15 min model and data as references, the electron density of the γ-phosphate also diminished over time, with a clear loss of density evident at ~5 h, indicating the onset of γ-phosphate release (Fig. 3A, 5-h difference map). Additional positive and negative peaks emerged in the switch I region and at Gly60 in switch II after 10 h (Fig. 3A, 10-h and 20-h difference maps), which is consistent with the structural changes accompanying GTP hydrolysis. Notably, the new positive electron densities in switch I (green) overlapped with the backbone position in the GDP-bound state (salmon) (Fig. 3A, 20-h difference map), suggesting a gradual transition towards the Ras/GDP conformation.
These results demonstrate that, upon uncaging, Ras rapidly adopts a natural GTP-bound conformation that retains state 1 characteristics and remains in this open conformation within the crystal lattice. Despite the expected state 1-to-state 2 transition occurring within milliseconds in solution, no structural features indicative of state 2 were detected in the crystal. Instead, Ras catalyzed GTP hydrolysis from a state 1 conformation that persisted throughout the crystallographic observations, with no detectable population of a state 2 configuration in the structural datasets obtained across the observed time window. These findings provide direct structural evidence that state 1 alone can drive hydrolysis, challenging the canonical model that requires transition through state 2 with a stabilized nucleophilic water.
Mechanistic basis for the stabilization of Ras/GTP state 1 and its direct conversion to the GDP-bound form without a state 2 intermediate
Given that Ras/GTP remained in the open state 1 conformation for several hours after uncaging in our crystal system and ultimately transitioned to the GDP-bound form without passing through state 2, we next sought to clarify the structural basis for this behavior. To this end, we performed detailed comparative analyses of the Ras structures at different time points, focusing on crystal packing interactions and intermolecular interaction energies that potentially stabilize specific conformational states.
We first addressed how the state 1 conformation was maintained after uncaging. We examined intermolecular contacts within the crystal, particularly at the A–C interface involving the switch I loop (Supplementary Fig. 3A and Supplementary Table 2). In the 15-min structure, which represents the natural GTP-bound form after complete uncaging, we identified both preexisting and newly formed intermolecular interactions. Specifically, the hydrogen bonds between Glu37 and Gln25 were retained from the pre-uncaged form, whereas two additional salt bridges (His27–Glu31 and Glu31–His27) emerged after uncaging (Supplementary Fig. 3B, C and Supplementary Table 3). These new salt bridges appear to stabilize Glu31 and Asp33 and restrict the movement of the switch I loop, including Tyr32 (Supplementary Fig. 3C, red arrowhead), thereby limiting the conformational plasticity required for the transition to closed state 2.
To assess whether this stabilization is energetically favorable, we performed intermolecular interaction energy calculations within the crystal context. The results indicated that the state 1 conformation is energetically preferred over state 2 by 11.2 kcal/mol in this crystal form (Supplementary Fig. 4 and Supplementary Table 4). Together, these observations suggest that crystal packing in the R32 space group not only accommodates but also actively stabilizes the open state 1 conformation of Ras/GTP following uncaging.
We then investigated how Ras proceeds to the GDP-bound conformation without passing through state 2. A comparison of the 15-min and 28-h structures revealed a marked positional shift in the side chain of Tyr32 (Fig. 3B, 28-h GDP-bound structure). In the 15-min structure, Tyr32 forms a hydrogen bond with the γ-phosphate of GTP (Fig. 3B, 15-min GTP-bound structure); in contrast, in the 28-h structure, following GTP hydrolysis, Tyr32 is no longer engaged in any interaction with the nucleotide and shifts inwards into the switch I loop (Fig. 3B, hypothetical transition model). Notably, this conformational change coincided with the loss of the previously observed intermolecular salt bridges via Glu31 (Supplementary Fig. 3D and Supplementary Table 3), indicating that the disruption of these stabilizing interactions facilitated the relaxation of the switch I loop (Fig. 3B, hypothetical transition model; for more information see Supplementary Discussion section 3-d). Molecular simulation results of the intermolecular interaction energy of the charged residues in switch I also support this conclusion (see Supplementary Discussion section 4). Packing analysis further revealed that this inwards motion could be accommodated without steric hindrance, enabling the conformational transition to the GDP-bound form (Fig. 3B, hypothetical transition model and 28-h GDP-bound structure; see Supplementary Discussion section 3-d).
Collectively, these findings indicate that the crystal environment effectively locks Ras/GTP into the open state 1 conformation through specific intermolecular contacts, delaying the rearrangement of switch I. Once hydrolysis proceeds and the γ-phosphate is released, the loss of the Tyr32–phosphate interaction and the associated salt bridges destabilize the state 1 packing, permitting a switch I rearrangement that leads directly to the GDP-bound form without passing through the closed state 2 conformation. Notably, all of these transitions occurred within the same crystal lattice without compromising diffraction quality, providing a crystallographic view of the conformational pathway of Ras coupled to hydrolysis.
Principal component analysis and solution NMR identify α3-helix dynamics as a key component of GTP hydrolysis-induced conformational change
To gain mechanistic insight into which structural elements of Ras contribute to GTP hydrolysis-induced structural transition to the GDP-bound state, we conducted principal component analysis (PCA) of the Ras crystal structures, and time-resolved solution-state NMR to track residue-level conformational dynamics.
Principal component analysis (PCA) is a dimensionality-reduction approach that identifies the dominant directions of structural variance within an ensemble of protein coordinates, thereby revealing collective conformational trends. By applying PCA to a set of related Ras crystal structures, we sought to determine which structural elements account for the major conformational variability associated with nucleotide state and hydrolysis.
We first performed PCA on 68 Ras crystal structures in the R32 space group (listed in Supplementary Table 6), including our three structures (before uncaging and 15 min and 28 h after uncaging) (Fig. 4A). Since the switch II region (residues 59–71) was disordered in our data, we treated this segment as a gap in the analysis. PCA revealed that two major axes, PC1 and PC2, account for the majority of the structural variance. PC1 primarily represented the degree of opening in the switch I loop, while PC2 captured variations in the C-terminal region of the α3-helix (Fig. 4A, B).
Along PC1, the structures clustered according to known Ras conformational states: the switch I loop was fully closed in the state 2 group, partially open in the Ras/GDP group, and mostly open in the state 1 group (Fig. 4B, PC1 structural representation). As expected, structures lacking the hydrogen bond between the γ-phosphate of GTP and Thr35— a key stabilizing interaction for switch I —tended to adopt an open switch I conformation, as reflected in their positions along the PC1 axis (Fig. 4A, B, PC1 structural representation). PC2, in contrast, captured differences in the conformation of the α3-helix, particularly the degree of its C-terminal bending toward (bent) or away from (straight) the α4-helix (Fig. 4B, PC2 structural representation). In state 2 structures, this axis further separated two substates, as described in previous studies48,49, which primarily differ in the conformation of the α3-helix C-terminus and the associated ordering of switch II (Fig. 4A). Although we could not directly evaluate switch II due to its disorder in our state 1 structures, the positions of our pre- and post-uncaging structures along PC2 closely resembled that of PDB ID 5B2Z, characterized by an unstructured switch II and a bent α3-helix (Fig. 4A, B, PC2 structural representation).
To examine the temporal progression of the conformational changes of Ras in solution, we carried out time-resolved 15N HSQC NMR experiments on Ras/NPE-GTP after photoirradiation. We monitored time-dependent changes in peak intensities to estimate apparent, residue-specific kinetic responses (Supplementary Fig. 5A–C and Supplementary Table 7). The average apparent rate constant across all assigned residues was k = 3.7 × 10⁻³ min⁻¹ (t₁/₂ ≈ 190 min), which was slower than the GTP hydrolysis rates measured by biochemical assays and solid-state NMR (k = 4.6 ± 0.5 × 10⁻³ and 4.8 ± 0.4 × 10⁻³ min⁻¹, respectively; Fig. 1B). Notably, certain residues, including Lys88 and Asp108, exhibited relatively larger apparent rate constants (k = 4.3 ± 0.2 × 10⁻³ min⁻¹). These residues are located near the α3-helix and its adjacent loop (Fig. 4C). Residues displaying similar apparent kinetics were spatially clustered, suggesting that conformational responses to GTP hydrolysis are not uniformly distributed across the protein but show region-dependent characteristics (Fig. 4C). Importantly, these differences are interpreted as variations in apparent kinetic sensitivity rather than as evidence for strictly ordered or sequential conformational events.
Notably, Lys88 and Asp108, which showed relatively larger apparent kinetic responses, also emerged as major contributors along PC2. This correlation suggests that conformational variability of the α3-helix—particularly its displacement away from the nucleotide-binding site—is closely associated with the overall structural transition toward the GDP-bound state and may represent a focal region for conformational coupling within the Ras functional cycle.
Together, our PCA and NMR analyses identify the α3-helix as a structurally and kinetically prominent region associated with Ras self-inactivation. While conformational rearrangements of this region were not clearly resolved in our crystal structures, solution NMR indicates that GTP hydrolysis is accompanied by distributed, region-specific conformational responses across the protein. The observed apparent rate constants further suggest that chemical hydrolysis precedes these conformational responses, consistent with a model in which γ-phosphate release is coupled to subsequent structural reorganization.
These findings underscore the importance of dynamic and spatially heterogeneous conformational responses, particularly involving the α3-helix, in the Ras GTPase cycle beyond the active site alone.
To visualize the complete process of GTP hydrolysis by Ras and elucidate the roles of its various conformational states, we conducted time-resolved, integrative structural analyses using crystals of the Ras/photocaged GTP complex. This approach enabled us to capture a continuum of structural transitions, spanning from milliseconds, at which time the caging group was released to form the native GTP-bound Ras, to several hours or days, ultimately reaching the GDP-bound form resulting from GTP hydrolysis.
Our study yielded several important findings. Crystalline Ras retained native GTP hydrolysis kinetics. Upon uncaging, the crystal structure rapidly adopted and stabilized in the GTP-bound state 1 conformation. In this state, neither the nucleophilic water molecule nor Gln61—the putative general base that activates the water—was visible. Over time, Ras underwent a transition from state 1 to the GDP-bound form. Remarkably, these extensive structural changes occurred within the same crystal lattice without any loss of crystallinity. Moreover, time-resolved solution NMR and PCA revealed that the conformational changes associated with GTP hydrolysis occurred progressively and heterogeneously across different regions of Ras, with the α3-helix emerging as a key player possibly in cooperation with switch II.
Notably, our state 1 Ras crystals (space group R32) contrasted sharply with those reported in previous studies (space group P3221), in which the GTP-bound state 2 was stabilized31,32. In the earlier P3221 crystals, GTP hydrolysis proceeded more rapidly than in solution, likely due to stabilization of the nucleophilic water molecule. In addition, those crystals lost diffraction quality during the course of Ras inactivation, which prevented structural determination of the resulting GDP-bound form.
Our findings challenge the prevailing view that intrinsic GTP hydrolysis in Ras requires passage through the state 2 conformation—an assumption based largely on prior structural studies. Our data therefore raise key questions (Fig. 1A): Is state 2 truly required for GTP hydrolysis? Can hydrolysis proceed directly from state 1 to the GDP-bound form without passing through state 2? And if so, what enables this alternative pathway?
To address this, we first examined whether Ras in the R32 crystals remained in state 1 and underwent direct conversion to the GDP-bound form without transitioning through state 2. Crystal packing analysis revealed that the stabilization of state 1 was promoted by salt bridges involving switch I at the crystal packing interfaces after uncaging. Packing energy calculations further suggested that the transition from state 1 to state 2 was energetically disfavored in this crystal context. Interestingly, both the GTP- and GDP-bound forms in our crystals lacked electron density for part of the switch II loop. In our previous study, we showed that switch II is stabilized via interactions between its C-terminal helical segment and the α3-helix—interactions critical for forming state 222. Thus, rearrangement of the α3-helix is necessary to support state 2, but such movement appears restricted in our crystals, particularly at interface A-D (Supplementary Table 2).
Together, these observations strongly suggest that in our R32 crystals, the GDP-bound form arises directly from state 1 without passing through state 2, emphasizing the critical influence of crystal packing and energetic constraints in determining conformational pathways.
We next explored how GTP hydrolysis can proceed in the absence of a stably localized nucleophilic water molecule or a structured switch II region. Over the years, three main hypotheses have been proposed for Ras-catalyzed GTP hydrolysis. The classical general base model posits that a general base (such as Gln61) deprotonates and activates a water molecule to initiate nucleophilic attack29. However, mutagenesis studies have failed to definitively identify such a general base. As an alternative, the substrate-assisted mechanism was proposed, in which proper positioning of the γ-phosphate and the nucleophilic water within the closed conformation of state 2 facilitates hydrolysis even in the absence of any other catalytic base50,51. This mechanism is supported by crystallographic data showing rapid hydrolysis even when residues adopt nonnatural conformations (e.g., Tyr32)52 and by neutron diffraction data suggesting protonation of the γ-phosphate53.
A more recent hypothesis, the solvent-assisted mechanism—supported by computational studies43,44—proposes that preorganization of the water molecule is not essential, provided it is appropriately oriented to attack the γ-phosphate directly. Our structural observations are consistent with this mechanism. Importantly, although the structural coordination network characteristic of the state 2 conformation is not established in our structures, the essential electrostatic framework of the active site remains intact: the γ-phosphate is coordinated by the P-loop, including Lys16, and by Mg²⁺, thereby preserving the charge environment required for transition-state stabilization. We note, however, that the absence of well-defined electron density for a nucleophilic water molecule in our structures does not exclude the involvement of transient or dynamically exchanging solvent molecules during catalysis, but rather indicates a lack of stable preorganization prior to hydrolysis. Moreover, the fact that, in solution, the nucleophilic water molecule is not rigidly localized, and that the T35A mutant—which remains in the state 1 conformation and cannot stabilize the water molecule—retains a hydrolysis rate only slightly lower than that of WT Ras, further supports this model (Fig. 1B and Supplementary Fig. 6)20. Together, these findings indicate that GTP hydrolysis can proceed via a solvent-assisted pathway even in state 1. We therefore do not propose a fundamentally new chemical mechanism, but rather suggest that strict preorganization of the nucleophilic water in a closed state 2 configuration is not an absolute requirement for catalysis.
The intrinsically slow rate of Ras-catalyzed GTP hydrolysis likely reflects limited catalytic preorganization of the active site in the absence of regulatory proteins. Although Ras contains the conserved P-loop and Mg²⁺-dependent nucleotide-binding architecture required for phosphoryl transfer, it lacks an intrinsic positively charged residue analogous to the arginine finger that can stabilize the developing negative charge in the transition state. In Ras, such electrostatic stabilization is instead provided by a GTPase-activating protein (GAP), whose arginine finger enters the active site and markedly accelerates hydrolysis. In addition, the conformational flexibility of the switch I and switch II regions may limit persistent positioning of catalytic groups and of the nucleophilic water molecule. Thus, the slow intrinsic reaction is likely to arise from incomplete transition-state stabilization and catalytic preorganization rather than from the absence of the fundamental chemical machinery required for GTP hydrolysis. Our observation that hydrolysis can proceed from a state 1-like conformation is consistent with this view, as catalysis can occur without a fully preorganized state 2 configuration, albeit on a slow timescale.
Consistent with the importance of catalytic preorganization, even adoption of a state 2 conformation does not necessarily ensure an optimal catalytic environment. For example, in Rap-mediated GTP hydrolysis, hydrogen bonding interactions between the nucleophilic water and surrounding residues reduce the reaction rate despite the adoption of the state 2 conformation14,54. Furthermore, the hydrolysis rate is temperature-dependent and correlates with the conformational transition rates. This suggests that thermal fluctuations, even in the absence of observable changes, may be crucial for water molecule reorientation and reactivity. In crystals, such motion is likely more constrained than that in solution, possibly impeding the formation of an optimal transition state. Thus, the broader mechanism of GTP hydrolysis likely involves multiple conformational pathways and dynamic contributions that remain to be fully elucidated.
We also investigated how the GDP-bound form is ultimately generated in crystals. Phosphate release, driven by electrostatic repulsion, likely triggers structural transitions. Although this crystallographic analysis did not reveal movements of the α3-helix, PCA and solution NMR highlighted its critical role for Ras self-inactivation through coordinated motion with the adjacent mobile switch II loop. Molecular simulations based on the state 2 structure suggest that γ-phosphate release requires an open switch I loop40,55,56. In our analysis, hydrolysis initiated from the open switch I conformation (state 1) facilitated product release. The release of the γ-phosphate disrupted the hydrogen bond network surrounding Tyr32, triggering a rearrangement in switch I, which rotated inwards to accommodate GDP while avoiding steric clashes with Tyr32.
Furthermore, solution NMR revealed nucleotide-dependent, residue-level conformational transitions throughout the Ras protein (Fig. 4C), which aligned well with the computational simulation results and suggested a stepwise progression of structural rearrangements57,58,59.
In summary, despite the limitations imposed by crystal packing and slow reaction synchronization, our study has captured what appears to be a direct hydrolysis pathway from state 1 to the GDP-bound form without detectable passage through state 2. The slow intrinsic hydrolysis rate of Ras is therefore consistent with catalysis occurring without complete preorganization of the state 2 catalytic configuration.
It should also be noted that the present study employed a truncated H-Ras construct (residues 1–166), which lacks the C-terminal hypervariable region. This truncated construct is widely used in structural and biochemical studies of Ras because it contains the complete catalytic domain and nucleotide-binding site. However, the flexible C-terminal region present in full-length Ras could influence crystal packing and potentially modulate conformational preferences. Therefore, while the catalytic features described here are expected to reflect intrinsic properties of the Ras GTPase domain, the structural ensemble observed in crystals may differ from that of full-length Ras in a membrane-associated context.
Unraveling the mechanisms underlying intrinsic GTP hydrolysis is therefore not only a matter of basic science but also has important therapeutic implications. The state 1 conformation, in particular, presents a promising druggable state: it features an accessible open structure while retaining hydrolysis activity. Intriguingly, cancer-associated mutants such as G12V and G13D are known to favor the state 1 conformation and resist GAP-mediated inactivation17,25. These mutants underscore the clinical significance of state 1. Furthermore, while the α3-helix and its surrounding regions have been successfully targeted by approved K-Ras G12C inhibitors60, these compounds are not designed to stabilize the state 1 conformation or to promote GTP hydrolysis. As such, the concept of enhancing Ras self-inactivation through efficient hydrolysis remains an untapped therapeutic strategy. Mechanistically, this could involve small molecules that subtly modulate the conformational ensemble of state 1—by promoting favorable γ-phosphate polarization, stabilizing productive electrostatic interactions, or facilitating transient water access—without necessarily enforcing a full transition to state 2.
With continued advancements in both crystallographic and solution-based structural techniques, our understanding of Ras dynamics is becoming increasingly refined. These insights can guide the development of therapeutic strategies, synthetic biological tools, and enhanced biochemical models. In this ongoing pursuit, the identification of alternative hydrolysis pathways may provide a broader framework for understanding and potentially targeting Ras-driven diseases.
Expression of unlabeled and labeled H-Ras and the H-Ras/caged GTP complex
Unlabeled or U-15N, 13C-labeled H-Ras (UniProtKB: P01112, residues 1–166) was overexpressed, purified and loaded with guanosine 5’-triphosphate, P3-(1-(2-nitrophenyl)ethyl) ester (NPE-caged GTP) (purchased from NARD, https://www.nard.co.jp/), as described previously21,22.
GTP hydrolysis assay
The GTPase activity of H-Ras was measured by quantifying the amount of free phosphate released from GTP upon GTP hydrolysis by Ras using a BIOMOL® GREEN kit (Enzo Life Sciences, Inc. BML-AK111-1000). In brief, 750 μM H-Ras/NPE(R)-caged GTP complex (without a free GTP analogue) dissolved in assay buffer (150 mM NaCl, 5 mM MgCl2, 50 mM Tris HCl, pH 7.4) was photoirradiated at 365 nm with an LED light source and incubated at 25 °C to trace GTP hydrolysis over time. Samples (0.8 μL each) were collected at each time point, diluted 20-fold with assay buffer and immediately heated to 95 °C to stop the reaction. The resulting sample was centrifuged at 15,000 rpm (20,000×g), and the supernatant was collected and mixed with BIOMOL® GREEN reagent (Enzo Life Sciences, Inc.), after which the absorbance at 620 nm was measured according to the manufacturer’s recommendation. The absorbance at each time point was plotted, and the kinetic data were fitted by using gnuplot 5.4.4 (http://www.gnuplot.info/) to calculate the hydrolysis rate constant.
Preparation of H-Ras/NPE(R)-caged GTP complex microcrystals
Seed Ras crystals were prepared via the sitting drop vapor diffusion method by mixing an equal volume of 13 mg/mL H-Ras/NPE(R)-caged GTP (in 50 mM NaCl, 5 mM MgCl2 and 1 mM DTT, 50 mM Tris HCl, pH 7.4) with the reservoir solution (18% polyethylene glycol 8000, 0.2 M calcium acetate hydrate, 0.1 M MES, pH 6.4) and incubating the drops at 20 °C for ~10 days. The resulting seed crystals were harvested, crushed with a glass pestle, sonicated and centrifuged at 15,000 rpm (20,000×g) to collect the supernatant (*), which contained microcrystalline seeds invisible to the naked eye. A solution of Ras microcrystals (with dimension of 7–10 μm) for use in the structural analyses was prepared by the batch method as described previously61. Briefly, an equal volume of ~35 mg/mL H-Ras/NPE(R)-caged GTP in solution was mixed with the supernatant (*) and incubated for 15 min at room temperature.
Solid-state 31P NMR crystallographic experiments and evaluation of the rate constants of GTP hydrolysis by H-Ras
The kinetics of GTP hydrolysis in the crystal were evaluated using solid-state 31P CP-MAS NMR of H-Ras/NPE(R)-caged GTP microcrystals. In this technique, the 31P chemical shift values of the β-phosphate group of nucleotides are appropriate indicators to clearly distinguish between the natural GDP-bound and GTP-bound forms of H-Ras, which produce 31P chemical shift values of ~−5 ppm and −20 ppm, respectively (Supplementary Fig. 1)62,63.
A sample of H-Ras/NPE(R)-caged GTP microcrystals was concentrated and added to a microcapsule. The microcrystalline slurry used for NMR measurements was prepared under identical conditions to those used for time-resolved crystallography, and was loaded without drying or dissolution in order to preserve the crystalline environment throughout the experiment. After sealing, the microcapsule was inserted into the 4.0-mm MAS rotor. Although the rotor can accommodate larger volumes, a 10 μL microcapsule was employed to confine the sample within the detection coil region, thereby maximizing the effective number density of nuclei in the sensitive volume and improving signal intensity. The microcapsule configuration also prevented sample leakage under MAS conditions and ensured that essentially the entire crystalline slurry remained within the detection region during spinning.
31P NMR experiments were performed on a JEOL ECA II spectrometer equipped with a 1H-X double-resonance probe at a 1H resonance frequency of 500 MHz. CP-MAS NMR measurements were carried out at room temperature (~25 °C) under a 10 kHz MAS frequency, and the CP conditions from 1H were a contact time of 2 ms and a repetition time of 4 s. To enhance sensitivity, 1H–31P cross-polarization was employed, which improves detection efficiency for 31P in solid-state measurements. The NMR data were collected after uncaging by irradiating the microcrystal sample from outside the microcapsule with near-UV light at 365 nm generated using an LED light source. The 31P chemical shifts were referenced to that of 85% H3PO4 solution at 0.00 ppm. The corrected data were subjected to fast Fourier transform (FFT) processing with a 100-Hz exponential window function using JEOL Delta (https://nmrsupport.jeol.com/).
To calculate the rate constant of GTP hydrolysis, the signal intensity of the β-phosphate of GDP was plotted at each time point, and the data were subjected to nonlinear regression analysis. The resulting curve fit the exponential curve well and followed the first-order kinetics model of the production of GDP from GTP with sum of squared regression (SSR), from which the GTP hydrolysis reaction rate constant was estimated.
Serial femtosecond crystallography (SFX) experiments
X-ray diffraction data were collected at beamline BL2 at the SACLA facility. The conditions of the diffraction experiments were as follows: XFEL pulse, 7.0 keV; beamsize, 1.69 μm (h) × 1.53 μm (v) (FWHM); and repetition rate, 30 Hz. An H-Ras microcrystal (a crystal number density of 5.5 × 10⁷ crystals ml⁻¹) in hydroxyethyl cellulose64 solution (20–24% (w/v)) as a high-viscosity matrix was applied to the sample cartridge of an injector65 with a 75-μm diameter nozzle and delivered at a sample flow rate of 0.625 μm min⁻¹. Diffraction images were collected with the experimental platform DAPHNIS66 using a multiport CCD. For uncaging, a light pump pulse at 310 nm was provided from an optical parametric oscillator (OPO) laser at 10 Hz, which was synchronized with the XFEL pulse at 30 Hz. The focal size of the pump light was set to ϕ 75 μm (FWHM, top-hat), and the output energy of the light pump pulse was 38.2 μJ per pulse. The offset value of the pump light center was set to 35.4 μm upstream from the XFEL. Hence, the delay times (Δt) after photoirradiation were 15 and 48 ms67.
The collected diffraction images were processed with a data processing pipeline68 based on Cheetah69 during data collection at the SACLA beamtime for real-time feedback, such as the hit rate. Diffraction images containing 20 spots were considered hits. The diffraction spots were searched by using the peakfinder8 function of CrystFEL70 (version 0.10.2). The data were indexed using DirAx71 or XGANDALF72, scaled and merged with a partialator in CrystFEL. The initial phases were determined via the molecular replacement method using the program Phaser73 in the Phenix program suite74. A previously solved structure (PDB ID: 3K8Y48) in which residues 29–39, 61–74, and 96–109 had been deleted was used as the search model. The structural model was iteratively refined with phenix.refine75 and Coot76. To analyse the conformational changes after photoirradiation, q-weighted isomorphous difference Fourier maps (qFo − Fo) were calculated with Xtrapol877, with the dataset and the structure model under dark conditions taken as a reference78,79,80.
Serial synchrotron crystallography experiments
To obtain freeze-trap data after uncaging, the microcrystals were centrifuged (3000×g, 3 min, 4 °C) and resuspended in 100 μL of cryoprotection buffer (15% polyethylene glycol 8000, 0.166 M calcium acetate hydrate, 0.083 M MES, pH 6.4, 16.6% (v/v) polyethylene glycol 400). The microcrystals suspended in a 1.5 mL microtube were irradiated with an LED UV light source (#C11924-111 for the controller and #L11922-402 for the head unit; Hamamatsu Photonics K.K.) for a total of 2 min, with four cycles of 30 s irradiation at 30 s intervals. The microcrystal suspensions were mounted on LithoLoops (Protein Wave Co., Nara, Japan) with a diameter of 1.0 mm and freeze-trapped with liquid nitrogen. Data collection was performed at beamline BL41XU at SPring-8 using the SSX method45 with the following conditions: wavelength, 1.0000 Å; beamsize, 5.0 μm × 4.0 μm (vertical: V × horizontal: H); photon flux, 2 × 10¹² photons s−1; scanning area, 750 μm × 900 μm (V × H); per a loop, 75 strokes of helical horizontal scan of 180 images with a horizontal translation of 5 μm and total rotation range of 45.0° were performed with vertical interval of 10 μm. All diffraction experiments were carried out at 100 K under cryogenic nitrogen gas flow.
To obtain room temperature X-ray data at 28 h after UV irradiation, experiments were performed at BL41XU using the HAG SSX method81. The microcrystals were photoirradiated in the same manner as those used in the freeze-trap experiment. After 28 h, the microcrystals were mounted on LithoLoops (φ 1.0 mm) coated with glue (containing 10% w/w polyvinyl alcohol and 5% v/v ethylene glycol). The diffraction data were collected under the same conditions as those used for freeze-trap data collection, with one difference: an attenuated X-ray beam at 50% intensity (40 kGy per frame estimated with RADDOSE-3D82) was used to mitigate radiation damage. Data collection temperatures therefore differed depending on the experimental design: freeze-trap datasets were collected at 100 K, whereas selected long-time-point measurements were performed at room temperature (298 K), and XFEL pump–probe experiments were conducted at 293 K.
To obtain freeze-trap data at each time point after photoirradiation (within 15 min, 2.5 h, 5 h, 10 h, and 20 h), the crystals were suspended under cryoprotection conditions, photoirradiated and mounted in the same manner as the uncaging crystals were. After photoirradiation, the crystals were incubated at 298 K for each predetermined duration and then freeze-trapped.
The diffraction images were recorded with an EIGER X 16 M or EIGER2 XE 16 M detector. The hit images were collected using Cheetah and subjected to data processing using CrystFEL and indexing with DirAx71 or XGANDALF72, after which the data were integrated and merged. The initial phase calculation and refinement were performed in the same manner as those performed in the SFX experiment73,74,75,76. The geometrical information was analysed using Coot and PyMOL. The intermolecular interactions and buried surface areas in the crystal packing were analysed using PISA83 in the CCP4 suite (Supplementary Fig. 3)84. The superimposition of the models was conducted with PyMOL using the pair_fit command, unless otherwise stated, using 92 Cα atoms in the secondary structures common to all the structures (corresponding to residues 2–10, 16–25, 39–46, 49–57, 77–83, 87–91, 93–104, 111–116, 127–137, 141–143, and 152–163). PCA was performed using the package Bio3D in R85 with the following applied structures (listed in Supplementary Table 6): Ras/caged GTP, Ras/GTP (15 min after uncaging), and Ras/GDP (28 h after uncaging) from this study and 65 crystal structures in space group R32 with the hexagonal setting (symbol H32 in the PDB). There were no gaps in the structures extracted from the PDB, beyond a gap from residues 59–71, which represents part of the switch II loop, and the core volume was set to 0.5 Å.
To avoid potential artifacts arising from temperature-dependent unit-cell variations, difference Fourier maps were calculated only between datasets collected under identical temperature conditions.
Solution NMR experiments
U-13C,15N-labeled WT H-Ras (residues 1–166) loaded with NPE(R)-caged GTP in NMR buffer (50 mM NaCl, 10 mM MgCl2, and 25 mM phosphate buffer, pH 6.8, containing 10% 2H2O) was subjected to NMR measurements at 298 K on a Bruker AVANCE III 600 instrument equipped with a triple resonance cryoprobe (TCI 600 H-C/N-D). The backbone 1H–15N resonance assignments for H-Ras/NPE(R)-caged GTP and H-Ras/GDP were determined via the typical sequential assignment method, which was based on two-dimensional 1H–15N HSQC spectra and the triple resonance spectra of HNCA, HN(CO)CA, HNCACB, HN(CO)CACB, HNCO, and HN(CA)CO. The acquisition parameters were as follows: number of scans = 1, dummy scans = 16, recycle delay ≈ 1.5 s, and TD = 2048 (direct)/256 (indirect), resulting in an acquisition time of ~7 min per spectrum. All of the spectra were processed with NMRPipe86 and analysed with NMRViewJ (One Moon Scientific, Inc., New Jersey, USA). Signal assignment and analysis were carried out with the MagRO-NMRView program87,88,89, supported by fully automated signal assignments with the FLYA module in CYANA version 3.98.1390,91.
To detect the backbone dynamics of H-Ras during GTP hydrolysis, 1H–15N HSQC spectra were acquired in phase-sensitive mode using Echo/Antiecho-TPPI gradient selection. Uncaging was achieved by photoirradiation at 365 nm using an LED light source from outside the sample tube (Supplementary Fig. 5).
Molecular mechanics-based interaction energy calculations
To investigate the effect of crystal packing on the stability of Ras, more detailed interaction energies with the surrounding Ras proteins were calculated. Missing amino acid residues and hydrogen atoms in our X-ray structures were added by Molecular Operating Environment (MOE) Ver. 2022.0292. Hydrogen atoms were added by Protonate 3D93. Only the atoms added by these methods were optimized in the Amber10:EHT force field. These structures were divided into fragments of amino acid residues, GTP molecules, GDP molecules, cations, and water molecules, and the molecular mechanics-based interaction energies for these fragment pairs were calculated by MOE. The calculated interaction energies between residues surrounding Thr35 in chain A and residues in chain C are summarized in Supplementary Table 5. The interaction energies were calculated by dividing the interaction energies into electrostatic, van der Waals, and solvation terms using the generalized Born model (GB/VI). To compare the interaction energies, we focused on the common amino acid residues Met1 to Thr58 and Tyr71 to His166.
Statistics and reproducibility
No statistical method was used to predetermine sample size. Sample sizes were chosen according to the requirements of each experimental approach to obtain data of sufficient quality for kinetic and structural analyses rather than for hypothesis testing or comparisons between experimental groups. For serial crystallography, sample size was not defined in terms of biological replicates; instead, large numbers of diffraction images from microcrystals were collected and merged to obtain datasets of sufficient completeness, resolution, and overall quality for structure determination. The experiments were not randomized, and the investigators were not blinded to allocation during experiments and outcome assessment. These procedures were not applicable to the time-resolved structural and spectroscopic analyses performed in this study.
GTP hydrolysis kinetics were analysed by fitting time-dependent data to a first-order reaction model. For the solution-based phosphate assay, aliquots were collected sequentially over the reaction time course from a single reaction preparation (n = 1), and rate constants were obtained by fitting the time-dependent absorbance data using gnuplot 5.4.4. For solid-state 31P NMR, a single microcrystalline sample (n = 1) was monitored repeatedly over the time course, and the time-dependent increase in the GDP β-phosphate signal was analysed by nonlinear regression using a first-order kinetic model to estimate the hydrolysis rate constant. The time-resolved solution NMR experiment was also performed using a single solution sample (n = 1), from which sequential spectra were acquired over the reaction time course. Sample amounts for the NMR experiments were selected to provide sufficient spectral quality for kinetic and structural analyses. Accordingly, uncertainties associated with fitted kinetic parameters reflect fitting uncertainty rather than variation among independent replicate experiments. No null-hypothesis significance testing, Bayesian analysis, analysis of covariates, adjustment for multiple comparisons, or effect-size estimation was performed.
For the time-resolved solution NMR analyses, resonances that could not be reliably fitted, had poor signal-to-noise ratios, or showed severe spectral overlap were excluded according to the data-quality criteria described in the corresponding Methods section. No other data were excluded from the analyses.
The solution-based phosphate assay, solid-state NMR, and time-resolved solution NMR measurements were not independently replicated. However, the principal kinetic and structural observations were examined using complementary experimental approaches, including biochemical measurements, solid-state NMR, solution NMR, time-resolved serial synchrotron crystallography, and time-resolved serial femtosecond crystallography. The study was therefore designed to assess consistency across complementary biochemical, spectroscopic, and structural approaches rather than reproducibility through repeated biological replicates.